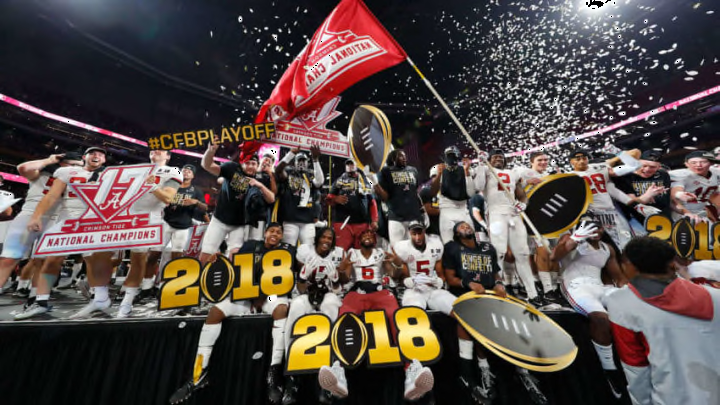
In terms of ‘CFB’s Most Dominant Team’ measured by the percentage of wins, in a decade, Alabama football is on pace to become the best-ever.
As with most college football records, measurement of a decade’s most dominant team does not have a single standard. The NCAA favors a straight-forward calculation beginning with the first season of each new calendar decade; e.g. 1950-1959. Following that logical format, Alabama football has two seasons left in its current decade.
With two seasons to go, Alabama football is No.2 in winning percentage by decade. Only teams having played a minimum of 50 games at the FBS level are calculated. With an eight-season record of 99-12, the Tide’s winning percentage is 89.19 percent. Trace college football records back to the 1920-1929 decade and the No.1 team in winning percentage is Oklahoma, 1950-1959, at 89.5 percent.
Will the Tide surpass the Oklahoma record?
Instead of useless predictions, let’s extrapolate some numbers from past wins and losses. Over the last four seasons, Alabama football has averaged 13.25 wins and 1.25 losses. If the Tide does well, but not as well in 2018 and 2019, as in 12-1 and 11-1 seasons, the decade’s winning percentage would be 89.51 percent, surpassing Oklahoma.
There are other less tidy ways to measure CFB’s greatest decade. If the ten-year span of 2008-2017 is used to measure Tide dominance, the winning percentage is 89.93 percent. Let’s see how other great runs compare.
The stats below come from Christopher Walsh.
- Oklahoma 1971-1980; 105-11, 90.5 percent
- Alabama 1971-1980; 107-13, 89.1 percent
- Oklahoma 1949-1958; 97-7, 93.3 percent
- Florida State 1991-2000; 89.1 percent
Walsh makes an interesting comparison in the decade runs of the four teams above. We combine his data with Alabama football in the 2008-2017 decade.
- In the Oklahoma decade, 1949-1958 the Sooners averaged playing 2.7 ranked teams per season.
- In the Alabama decade, 1971-1980 the Crimson Tide averaged playing 3.6 ranked teams per season.
- In the Oklahoma 1971-1980 decade, the Sooners averaged playing 4.9 ranked teams per season.
- In the Florida State decade, 1991-2000 the Seminoles averaged playing 5.7 ranked teams per season.
- In the Alabama decade, 2008-2017 the Crimson Tide averaged playing 6.7 ranked teams per season.
After comparing the ranked competition and the winning percentages, it can be argued Alabama (2008-2017) and Florida State (1991-2000) had the best decades of performance. Between Alabama and FSU, the Tide had a higher winning percentage (89.93 to 89.1 percent); the toughest competition (6.7 to 5.7) average games against ranked teams AND the most national championships (5-2).
The impressive winning percentages from the two Oklahoma decades clearly came against weaker competition.
Next: Speaking of Dynasties - Alabama-Saban Dynasty is the Greatest
Admittedly, the NCAA measurement of decades following calendar years is more clear. Alabama football fans will have to wait two more seasons to see if the Tide can become No. 1 in that measurement as well.
